
Graphics and infographics
Graphics are an essential ingredient for sticky learning.
They transform dull, text-heavy content into memorable, easy-to-understand concepts.
That’s why we serve fresh, thought-provoking and relevant visuals that bring content to life.
Want your learners to lean in?
We mix in eye-catching illustrations, visual metaphors and clever infographics – to make them go ‘hmmm’…

Get in touch!
A picture is worth a thousand words. Really.
Hungry Minds visuals will take your learning from ‘meh’ to ‘aha!’

Break down complex information
Sometimes, a process or concept can seem overwhelming when it’s just a wall of text. But – turn that same information into a beautifully-designed flowchart or infographic, and it becomes manageable, understandable, and even enjoyable to learn.

Make learning engaging and interactive
No more boring, static learning content. With the power of graphic design, we can create eLearning modules that are not only visually stunning, but also highly interactive. Think clickable diagrams, animated infographics, and immersive visual scenarios that make learners feel like they’re right in the middle of the action.

Provide on-the-job support
Learning doesn’t stop when a program ends. That’s why we design practical, visually appealing job aids and quick reference guides that learners can use on the job. These tools help reinforce key concepts, provide at-a-glance information, and help learning to stick.
Want a quick quote?
For memorable graphics that explain concepts at a glance.
Let’s talk! 1300 162 393
FAQs
Our affiliate partners, Learning Labs, collaborate closely with clients to develop a comprehensive learning strategy. This holistic approach creates a unified plan for building a robust learning culture within organisations, aligning learning initiatives with big-picture business objectives.
At Hungry Minds, we don’t bolt graphics onto learning as an afterthought—we integrate them from day one as essential learning tools.
Our approach:
- We identify the trickiest concepts that need visual explanation early in the design process
- We create custom visual metaphors that make abstract ideas concrete
- We design visual hierarchies that guide attention precisely where it needs to go
- We ensure graphics support rather than compete with other content
- We test visuals with actual learners to confirm they genuinely aid understanding
Graphics aren’t the garnish on our learning designs—they’re key ingredients in the recipe for comprehension.
While others treat graphics as decoration, we see them as cognitive tools that transform how information is processed and remembered.
Our difference is simple: we’re learning experts first, visual communicators second. Every graphic choice we make is driven by solid learning science, not just aesthetic preferences.
We also avoid the one-size-fits-all trap. We select the exact right visual format for each learning need—whether that’s a subtle text highlight or a comprehensive interactive infographic.
The result? Learning visuals that don’t just look good, but actually work hard to create genuine understanding. Because at Hungry Minds, we’re not satisfied with training that’s merely seen—we create learning experiences that are truly understood.
We’ve seen it all—the good, the bad, and the downright confusing:
- Decoration over function: Slapping in stock photos that look nice but add zero learning value.
- Visual overload: Cramming every available space with graphics until learners’ eyes don’t know where to land.
- Misaligned complexity: Using overly simplified graphics for complex concepts (or vice versa).
- Cultural disconnects: Using visual metaphors that don’t translate across your diverse workforce.
- Brand obsession: Prioritising rigid brand guidelines over learning effectiveness.
We help clients avoid these pitfalls by focusing on what matters: graphics that serve learning first, branding second, and egos never.
Matching graphics to learning objectives isn’t guesswork—it’s where our science meets your specific needs.
For knowledge-building, we use clear representational graphics that establish visual anchors.
For process learning, we craft sequential visuals with thoughtful pacing that guide learners step by step.
For problem-solving, we design scenario-based graphics that contextualise challenges in relatable settings.
For behavioural change, we create emotionally resonant visuals that connect desired actions to meaningful outcomes.
It’s not about using graphics because they look nice—it’s about selecting precisely the right visual tool to unlock specific types of understanding. That’s the Hungry Minds difference.
Inclusive visual learning isn’t optional—it’s essential. Our approach ensures no learner is left behind:
- We incorporate alternative text descriptions for all meaningful graphics to support screen reader users.
- We ensure sufficient contrast ratios that exceed accessibility standards for all text elements.
- We design with colour-blindness in mind.
- We provide multiple representations of key concepts, knowing that different learners process information differently.
- We test our visual materials with diverse user groups, including those with various abilities and learning preferences.
Beautiful learning should be for everyone—and at Hungry Minds, we make sure it is.
Graphics are visual elements that communicate information through images, icons, and visual design. Think of them as the eye candy that makes your learning materials pop.
Infographics take this a step further – they’re visual storytellers that combine graphics, data, and text to explain complex concepts in a digestible, at-a-glance format. They’re like the superhero version of regular graphics – doing more heavy lifting to explain tricky concepts.
Good graphic design isn’t just about making things pretty – it’s about making learning stick.
When information looks good, learners actually engage with it (shocking, we know). Well-designed materials reduce cognitive load, highlight key information, create visual hierarchy, and trigger emotional connections. The result? Learning people lean into, not away from.
Our brains process visual information 60,000 times faster than text, which means good graphic design helps your team learn more efficiently and retain information longer. It’s not decoration – it’s strategy.
Graphics in education aren’t just pretty pictures—they’re learning accelerators. They capture attention, simplify complexity, bridge language barriers, and make abstract concepts concrete.
Good graphics reduce the mental gymnastics needed to process information, which means your team can focus on understanding rather than decoding. They also trigger emotional responses, making content more memorable and meaningful.
Bottom line? Graphics transform “meh” learning into moments that matter. They’re how we turn forgettable info-dumps into knowledge that sticks.
Infographics turn learning from a slog into a sprint. They’re particularly brilliant at:
- Making complex information digestible (goodbye, information overload)
- Boosting retention by engaging both visual and verbal processing
- Creating “aha!” moments when relationships between concepts suddenly click
- Supporting diverse learning preferences
- Providing handy reference tools learners actually want to keep and share
At Hungry Minds, we use infographics strategically—not just because they look good, but because they help your team grasp, remember and apply information faster.
Infographics are learning superheroes because they work with how our brains are actually wired. Our visual processing systems are ancient and powerful—we process images 60,000 times faster than text.
They’re also masters of compression, turning paragraphs of explanation into instant understanding. This reduces cognitive load, meaning learners have more mental energy for actual thinking rather than decoding.
The best bit? Infographics create emotional connections through colour, imagery and design that boring text simply can’t match. And when learning triggers emotion, it sticks.
Visual design isn’t just the icing—it’s baked into the cake of effective learning. It organises information, creates clear paths for the eye to follow, and establishes what’s important (and what’s not).
Well-crafted visuals reduce cognitive overload, which means your team’s brains aren’t wasting energy trying to make sense of messy information. Instead, they can direct that mental energy to actual learning.
In a world of constant digital noise, thoughtful visual design is what separates learning that captivates from content that gets closed.
The fab four of graphics in learning design:
- Representational graphics: Show what something looks like – photos, realistic illustrations, and detailed drawings.
- Organisational graphics: Structure relationships between concepts – flow charts, timelines, concept maps, and process diagrams.
- Interpretive graphics: Explain invisible or complex concepts – visualisations of data trends, cross-sections of objects, or abstract concept illustrations.
- Transformational graphics: Show movement or change over time – animations, videos, interactive simulations, or before/after comparisons.
Each type serves different learning needs, and at Hungry Minds, we’re experts at knowing which one will help your content truly click.
For learning-focused infographics:
- Start with clear learning objectives—what should people know or do after seeing this?
- Craft a narrative that builds understanding step by step, rather than just dumping facts.
- Use visual hierarchy to guide eyes from most to least important information.
- Incorporate meaningful interactivity where possible—from simple hover states to more complex reveal interactions.
- Include reflection prompts or application questions that turn passive viewing into active learning.
The best infographics don’t just inform—they transform understanding by making complex information beautifully obvious.
Every knockout infographic combines these five essential elements:
- A compelling headline that hooks attention and clearly signals what knowledge awaits.
- Streamlined content that’s been ruthlessly edited to include only what matters. No fluff, no filler.
- Strategic visuals that explain rather than decorate—every icon, chart, and image should lighten the cognitive load, not add to it.
- Thoughtful layout that creates a natural visual journey, guiding the eye exactly where it needs to go.
- A consistent visual style that unifies the piece and reinforces your brand identity (because learning should look as good as it feels).
When these elements work in harmony, the result is learning that’s both beautiful and brain-friendly.
Graphic organisers are structured visual tools that help learners capture, sort, and connect ideas – think mind maps, flow charts, and Venn diagrams. They’re like mental scaffolding that helps build understanding. (We build these too!)
Infographics are more comprehensive visual stories that combine multiple elements to explain a concept from start to finish. While graphic organisers help learners organise their own thoughts, infographics present pre-packaged information in a visually engaging way.
Graphic text refers to visually-enhanced text elements like callouts, pull quotes, or stylised headings that draw attention to important information. It’s a way to make your text work harder without the learner working harder to read it.
Infographics combine text, data, and visuals in a cohesive design to tell a complete story. Think of graphic text as emphasis on key points, while infographics are the whole show – delivering information through a carefully choreographed dance of visuals and text.
WORD ON THE STREET
OUR
CLIENTS
LEARNING
PICK ‘N MIX
We’ve got all the ingredients to make your learning program deliciously effective.
LEARN WHAT WE HAVE
DONE FOR YOU
Every industry has learning challenges. We eat those for breakfast.
Different sectors, same result: learning that actually sticks.
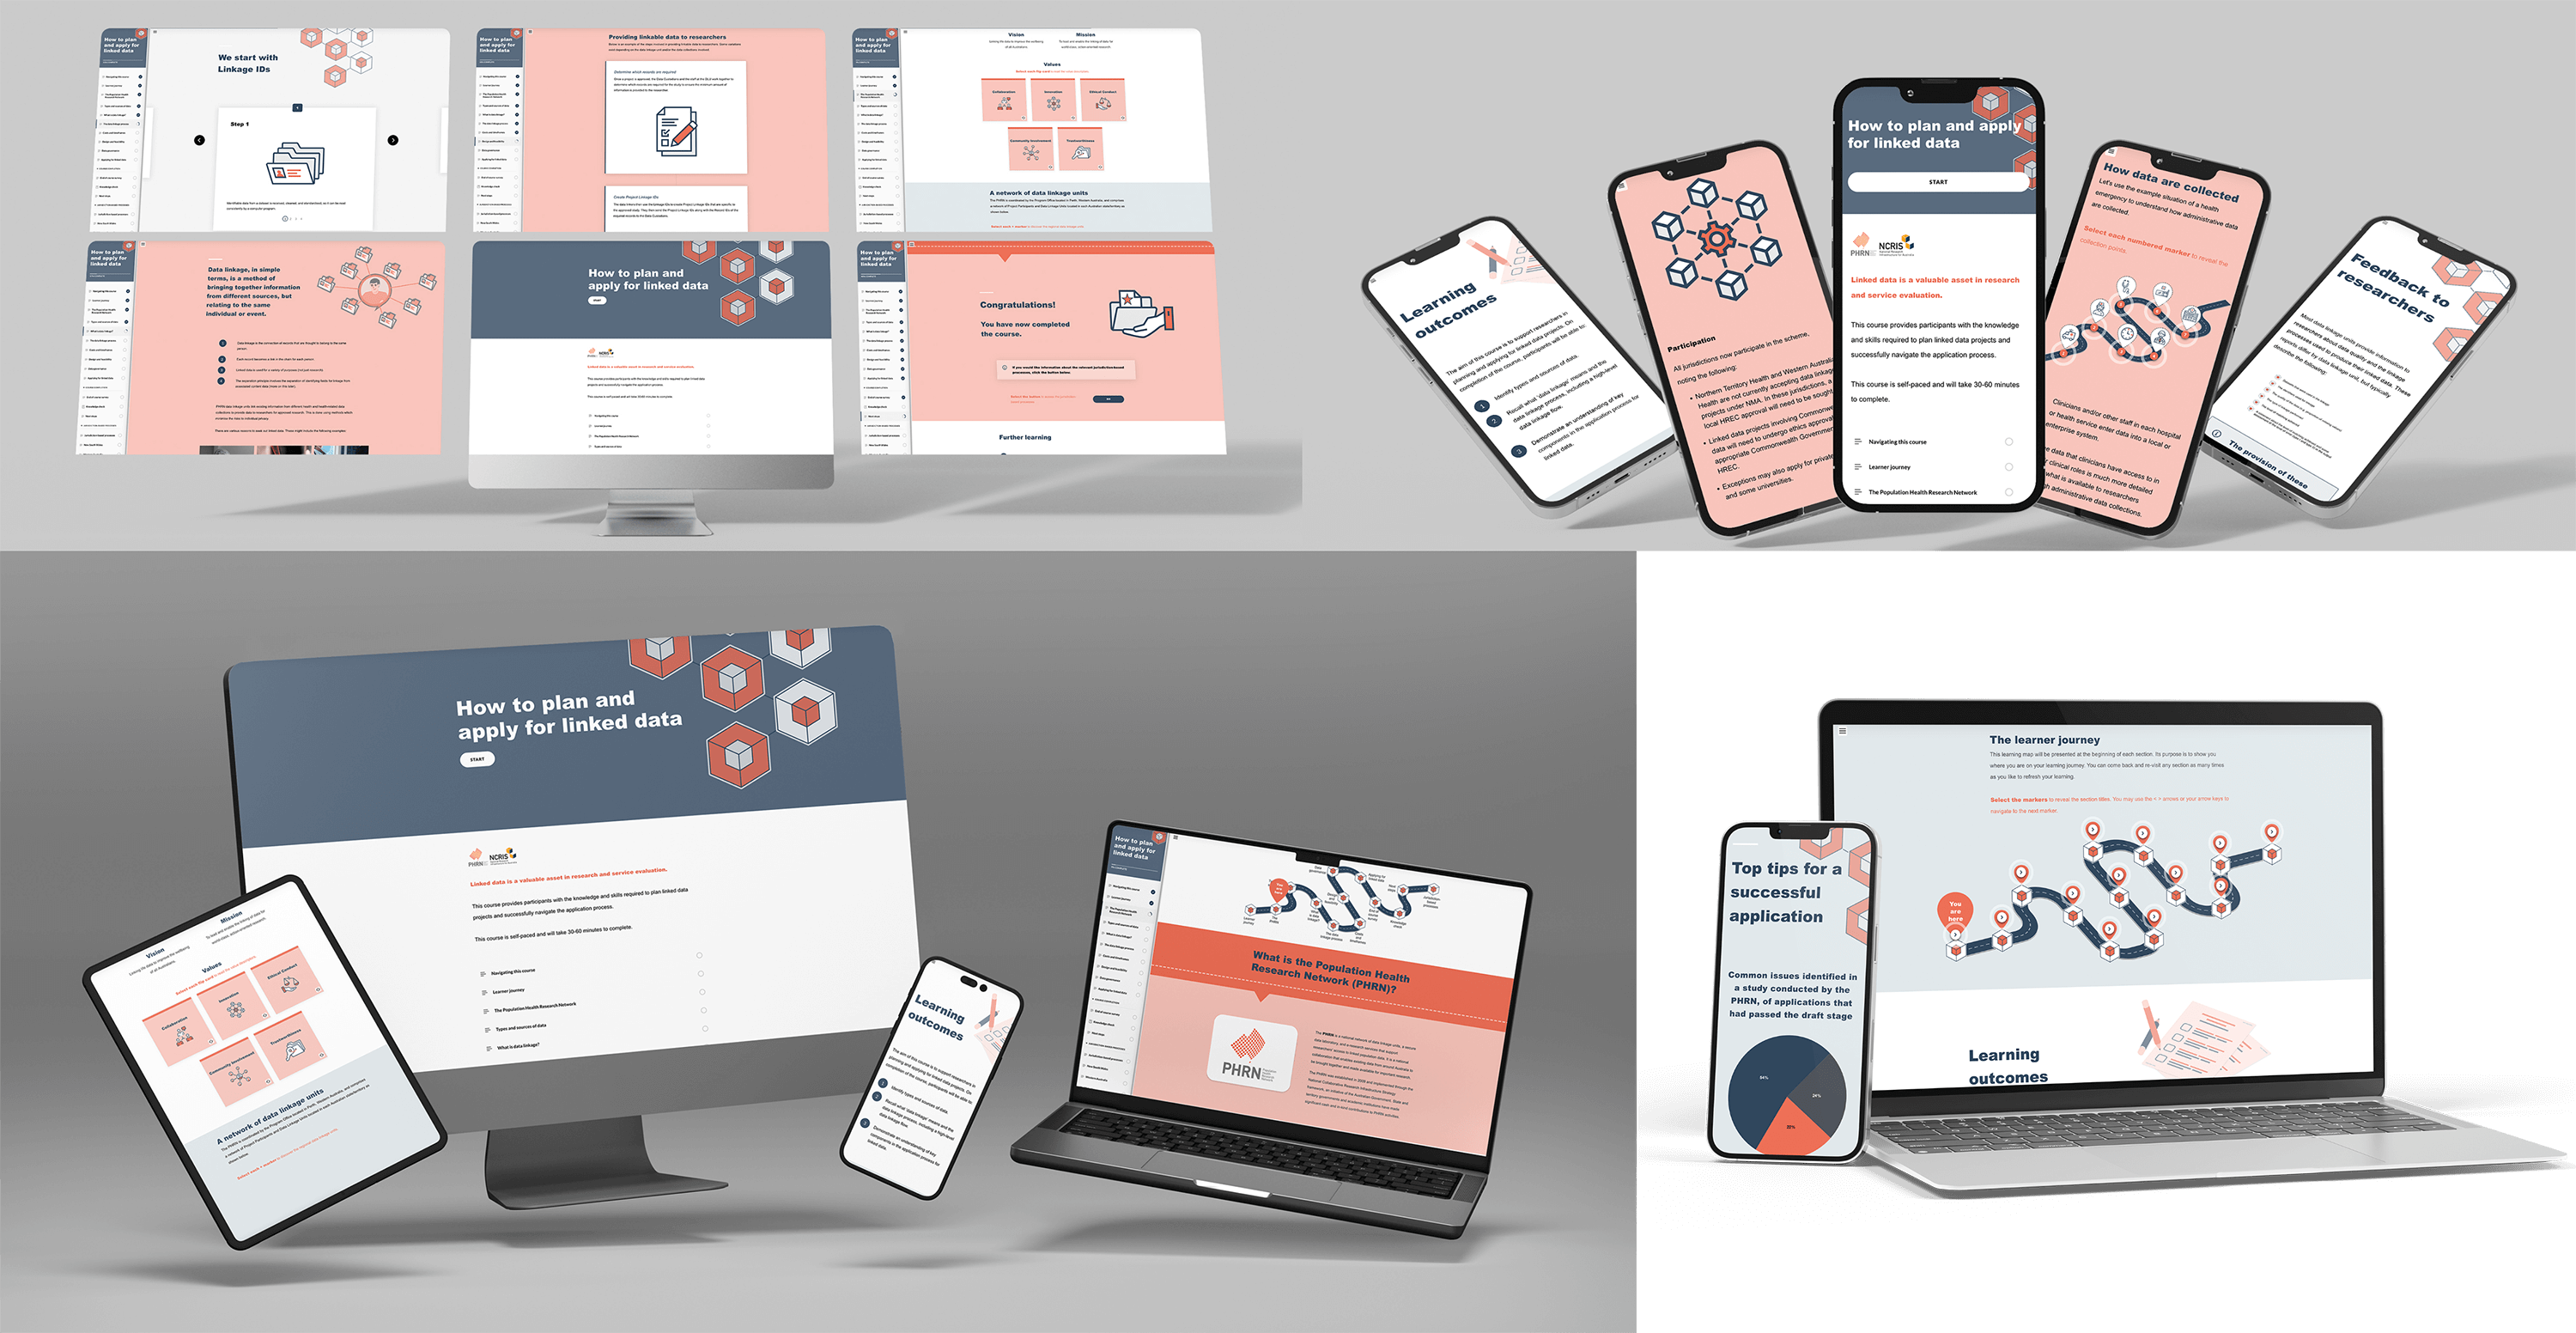
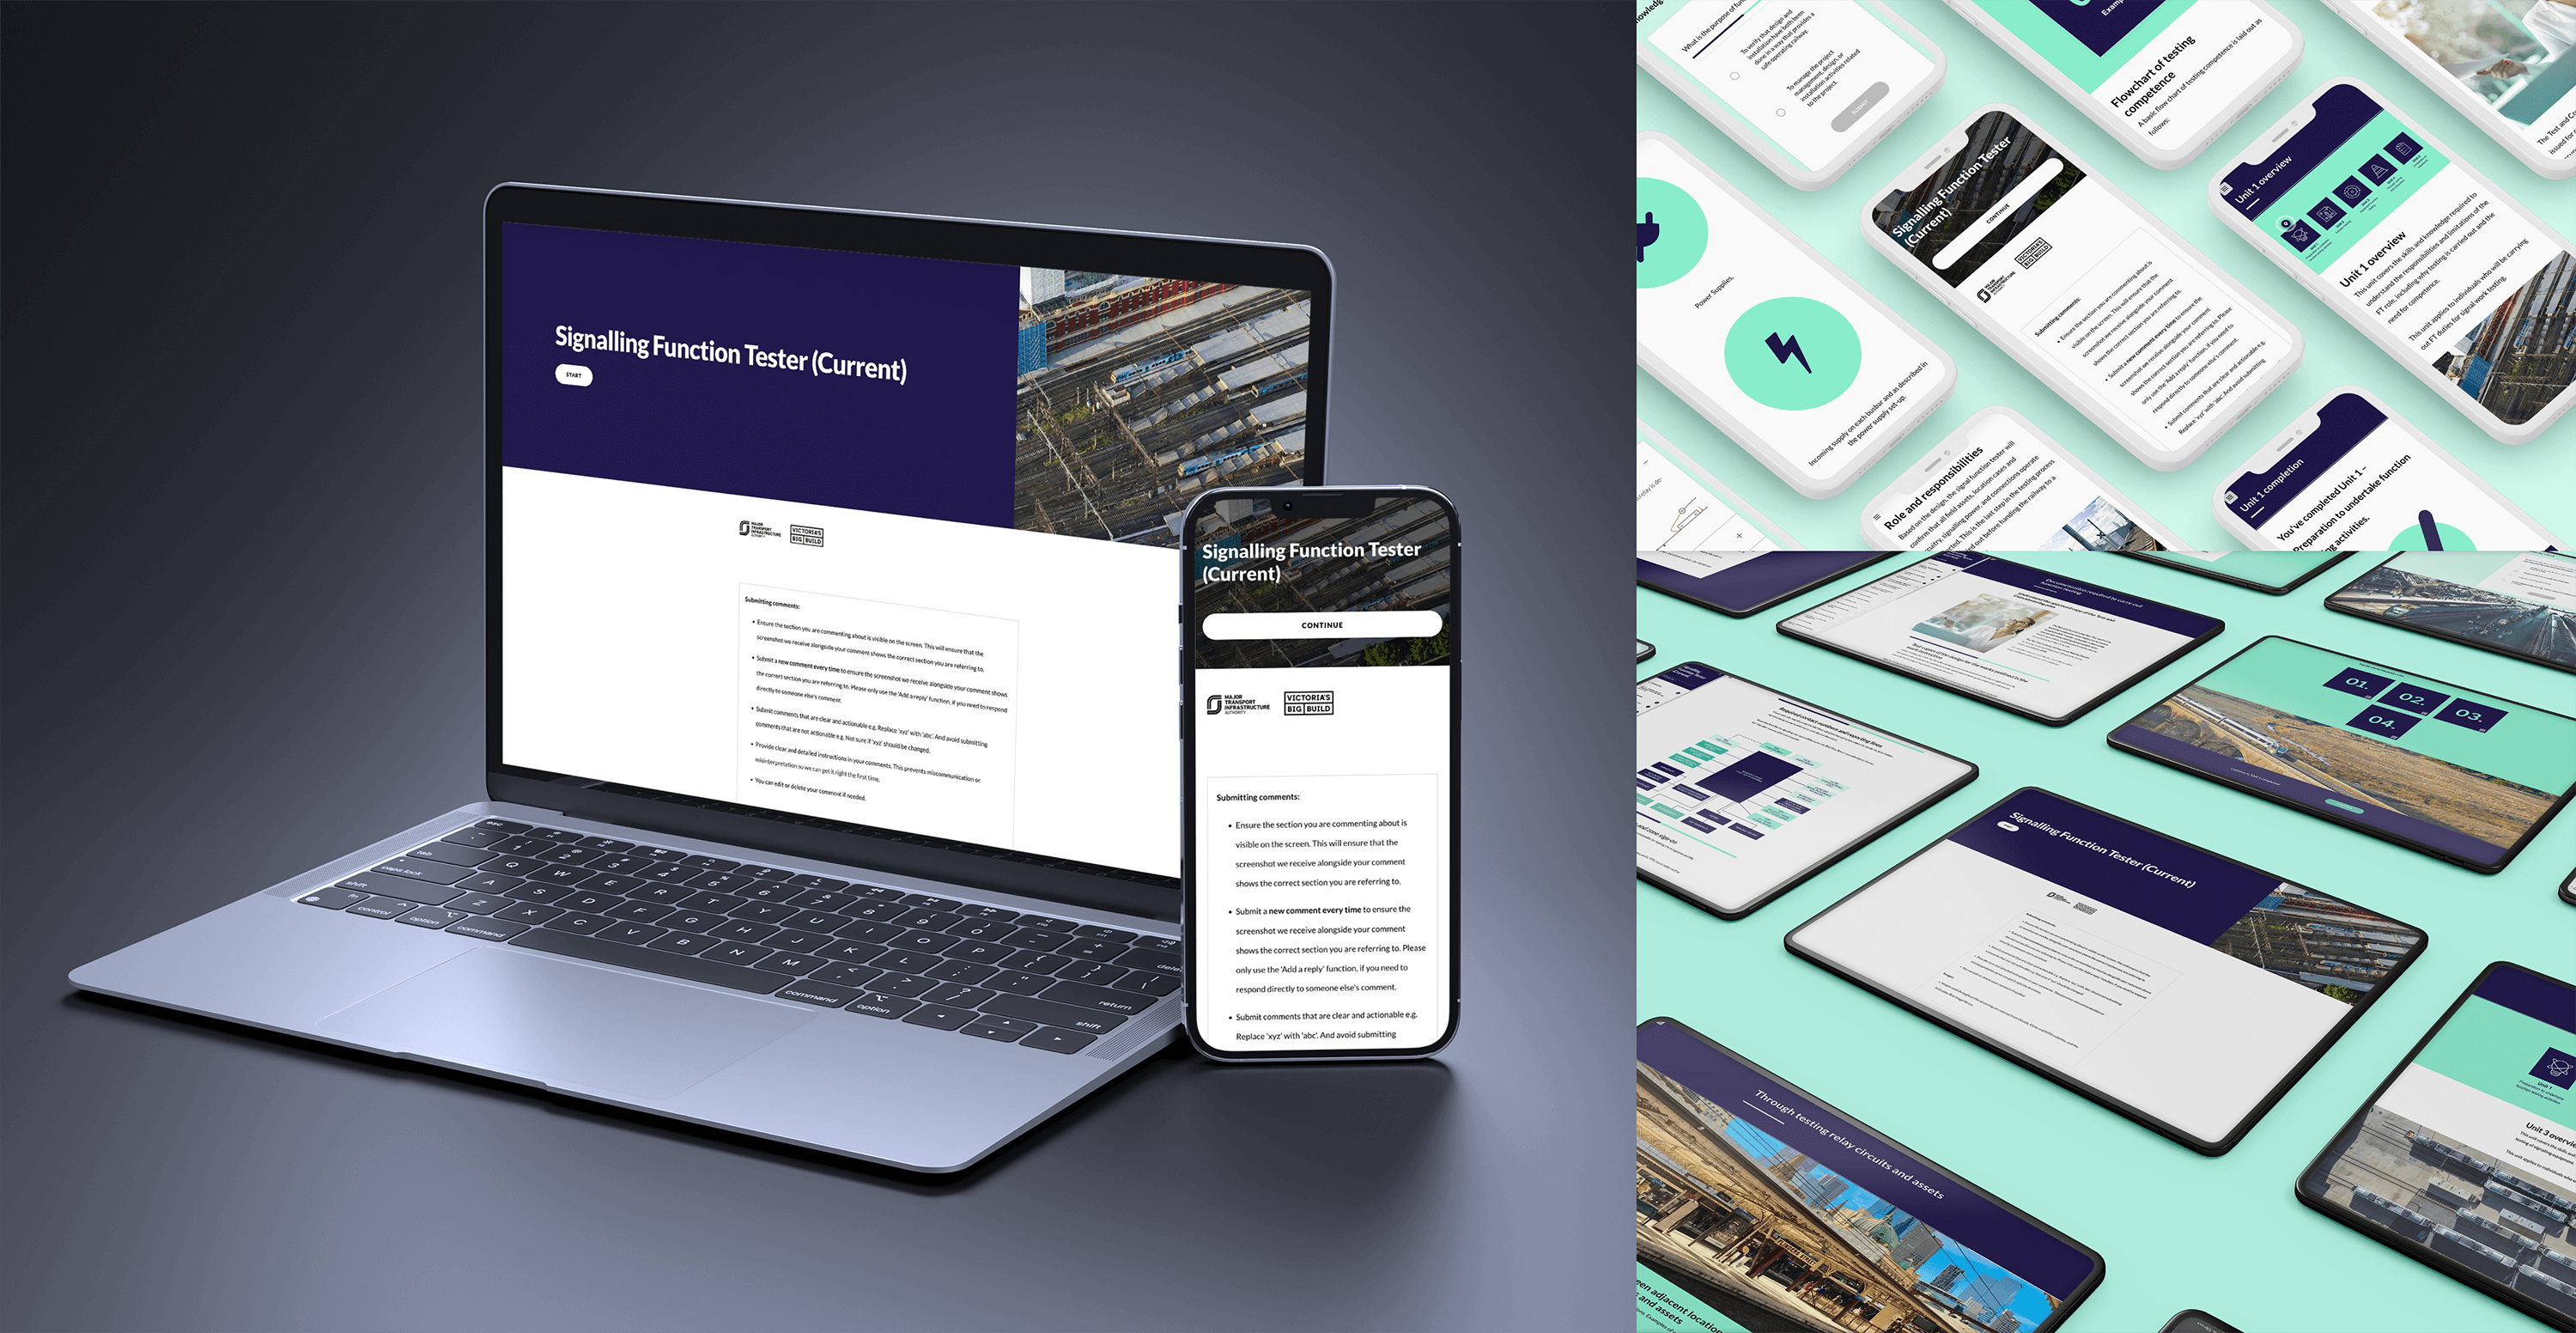
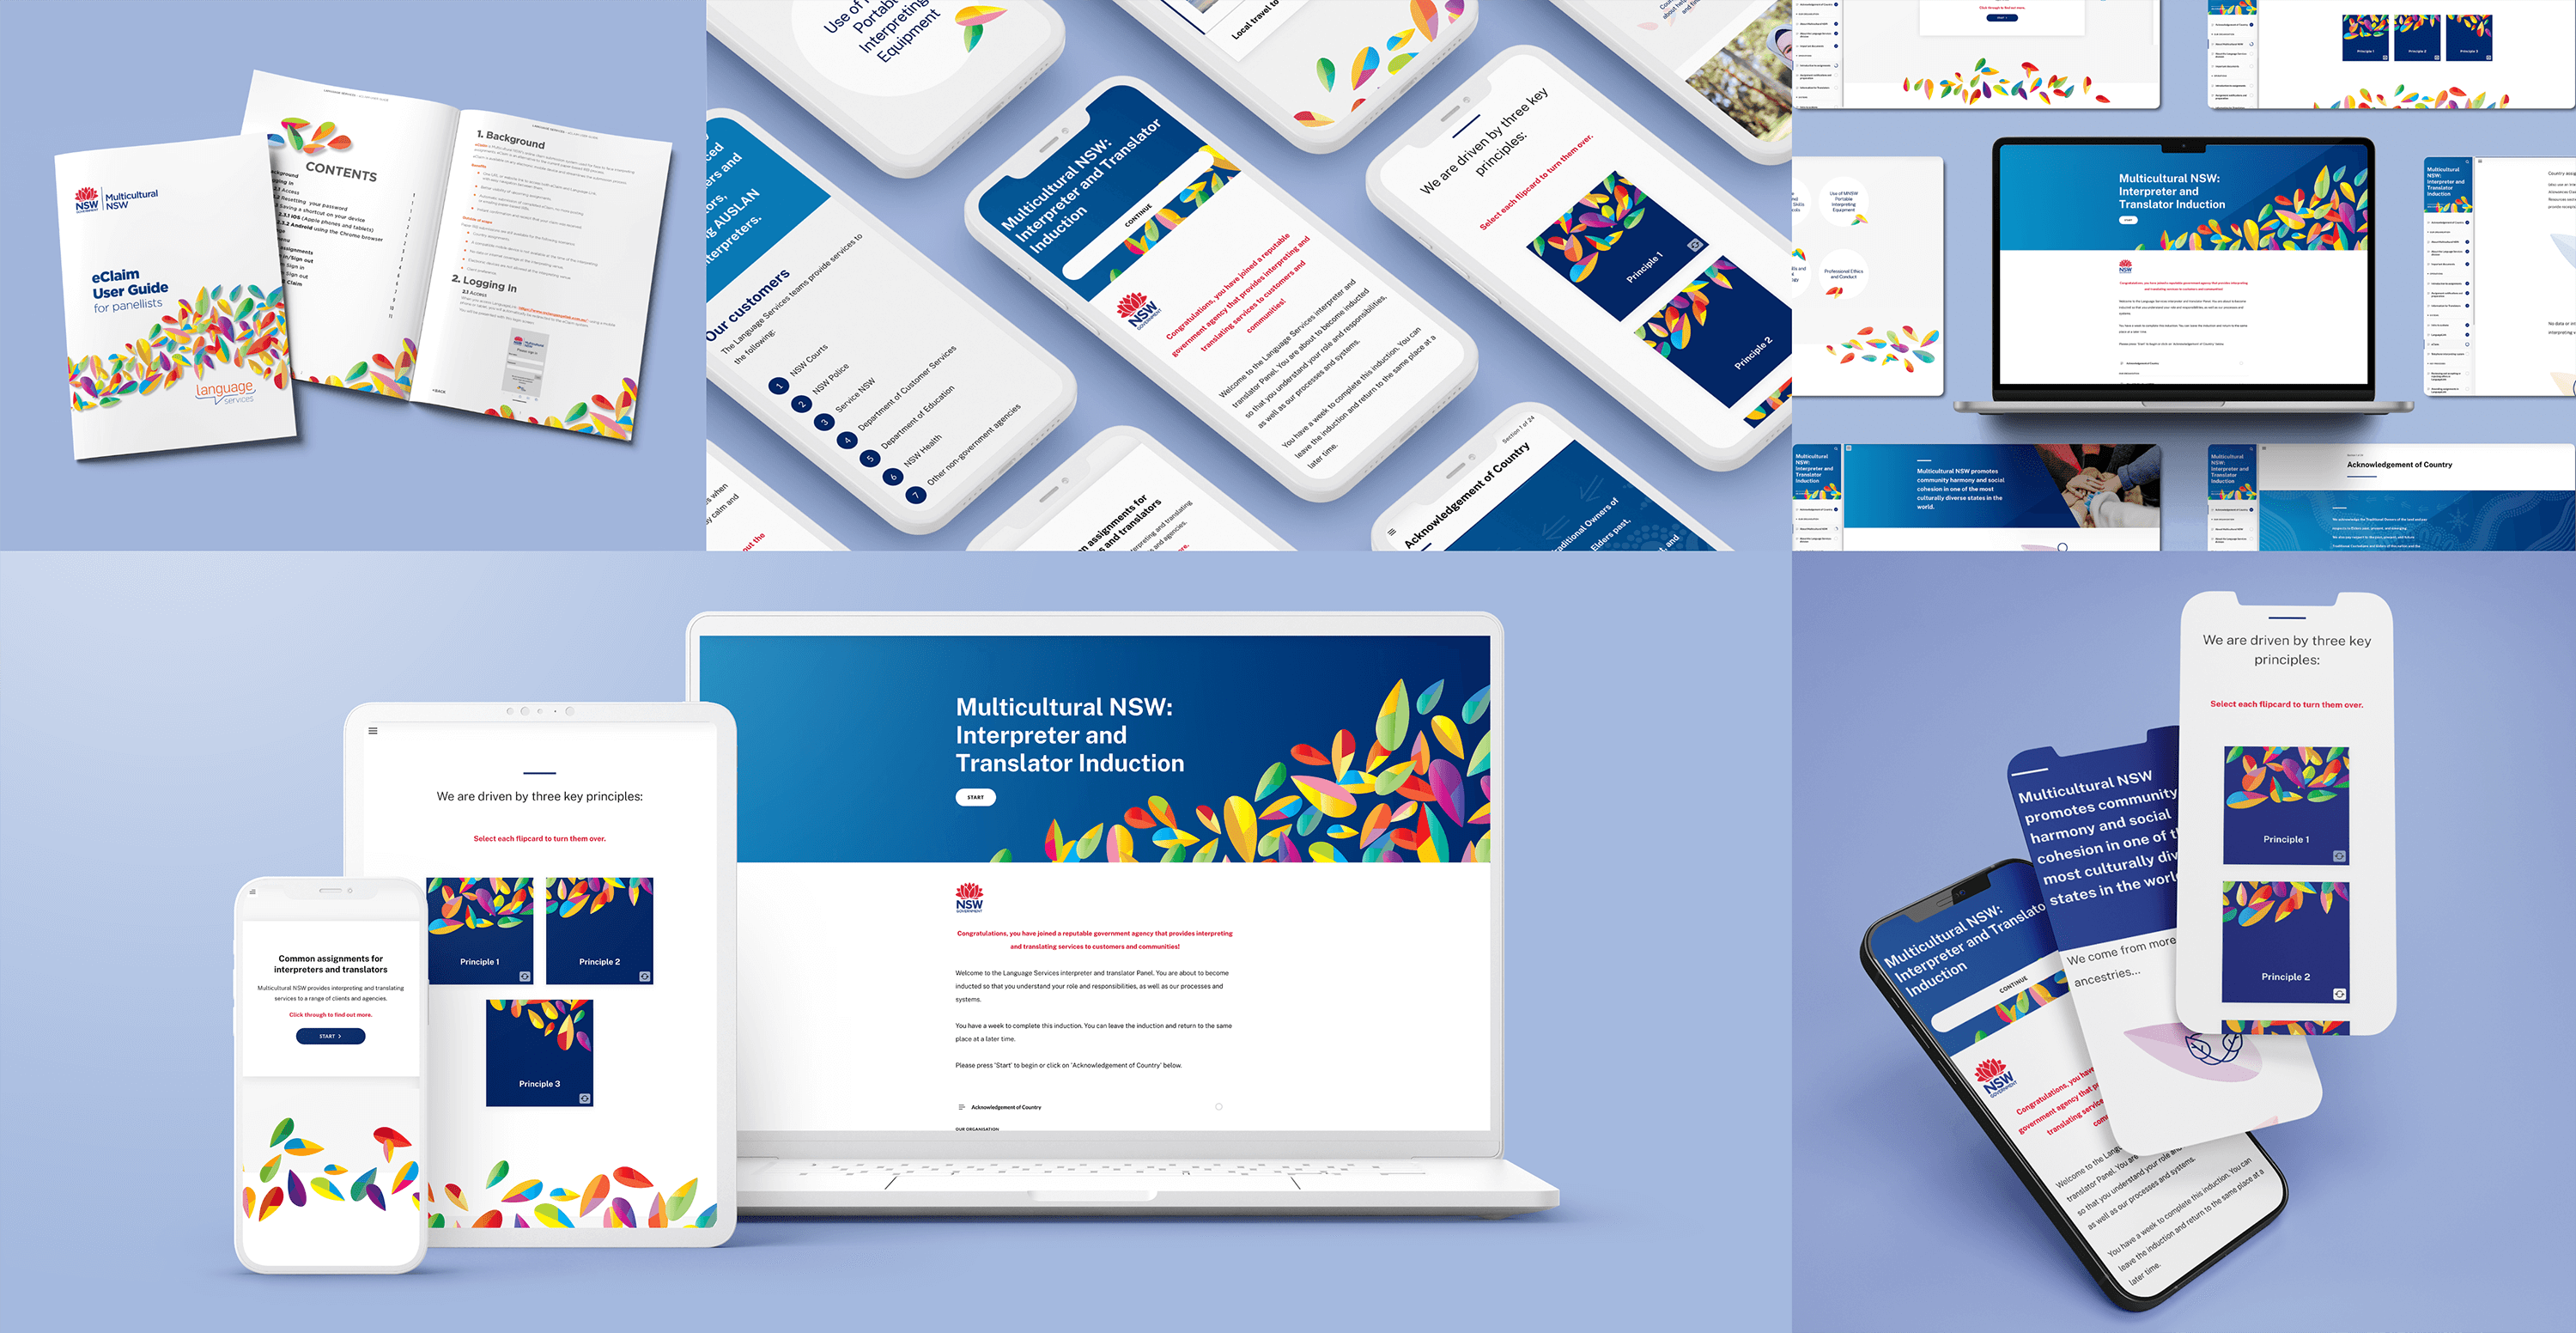
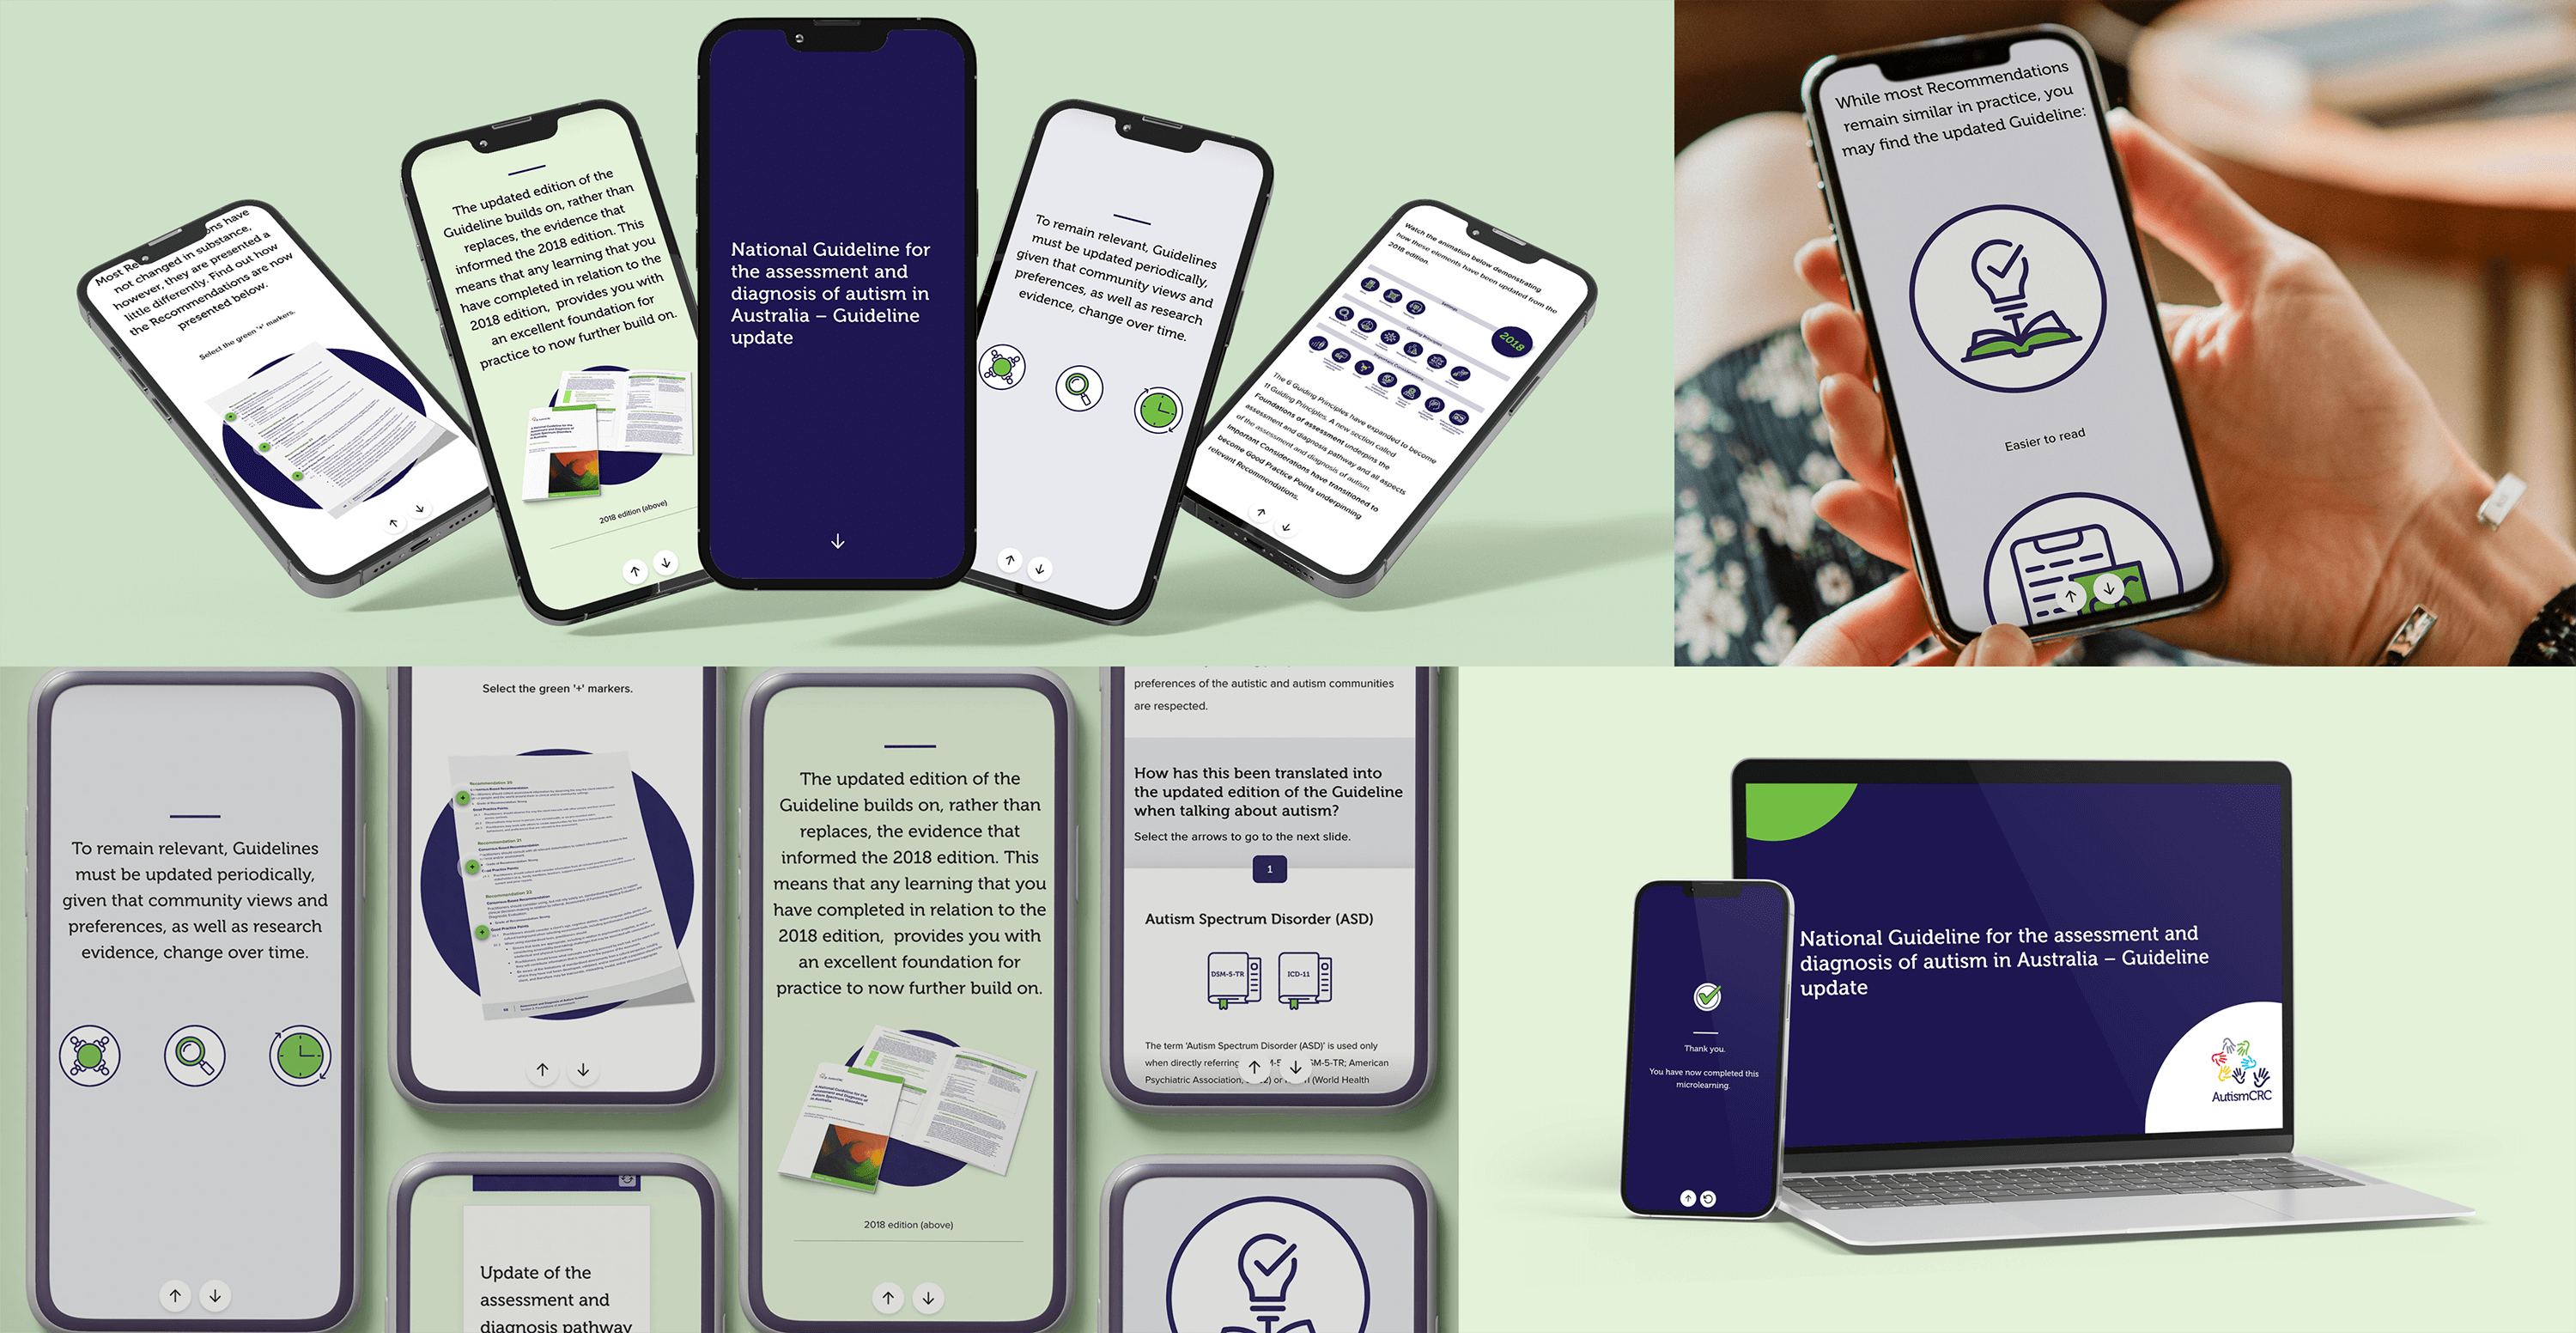
CASE
STUDIES
Mitigating Vicarious Trauma
